How big is the precious metals market?

Today we’ll try to answer question about the size of the precious metals market. This is a legitimate question in the context of recent price increases, but at the same time it should give esteemed readers some perspective and scale of comparison against other asset classes.
Does size (including abstractive) really matters?
Today we’ll try to answer question about the size of the precious metals market. This is a legitimate question in the context of recent price increases, but at the same time it should give esteemed readers some perspective and comparative scale to other asset classes. Simply as at a certain level, numbers and values become less comparative and more abstract, sometimes causing strong cognitive dissonance.
This is in addition exacerbated by terminology used for English speakers and for the rest of the world. There is a different nomenclature for numbers - short and long scale. The million (1,000,000) used in the world is the English million, but a milliard (1,000,000,000) will be written in English as billion. Our billion (1,000,000,000,000) in London and Washington D.C., will be known as trillion. And there are also some local variations occurring primarily in East and South Asia, reaching traditional number formats. In India, Nepal and Sri Lanka, for example, we will encounter ‘lakh’ (100,000), meaning one hundred thousand, and crore (10,000,000), which is equivalent of 10 million. As big finance remains dominated by the English-speaking world and therefore short scale, it is important to keep this simple fact in mind when analysing data or values.
All right, but what about the relative abstractness of value? Take earnings for example - according to the Central Statistical Office (GUS) in Poland, for the first half of 2024, statistical national average oscillates at 8.4 thousand PLN per month. Of course, in reality it varies dramatically depending on the region or location and the methodology of its calculation is understandably controversial, making it unlikely to be a representative.. But that's the way it is with statistics - the author and neighbour’s dog, each have statistically three legs...
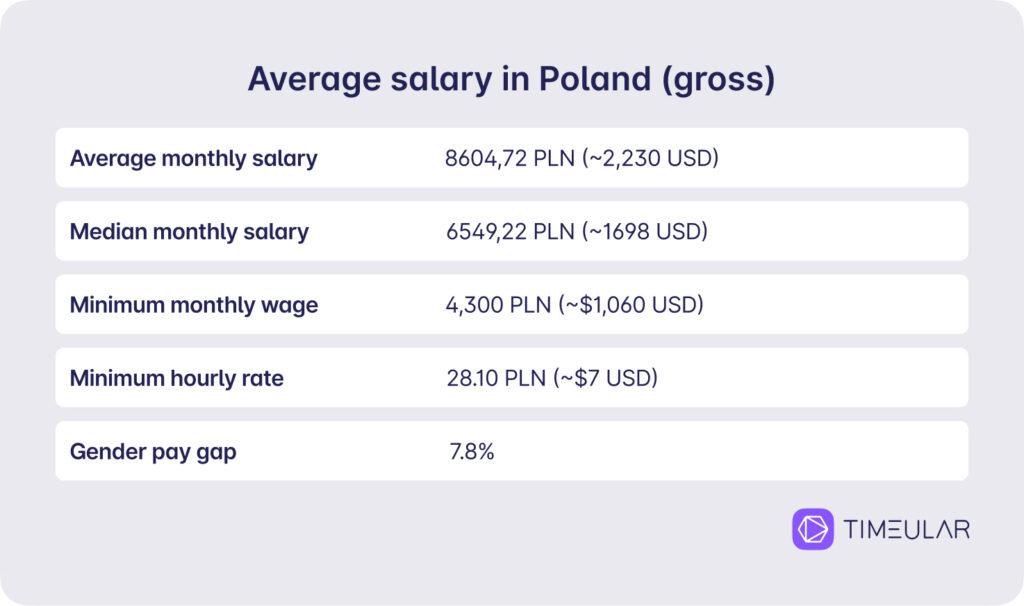
Average salary in Poland, median, minimum wage, minimum hourly rate and the difference in wages between women and men based on official data from the Central Statistical Office. Source: https://timeular.com/pl/srednia-krajowa/polska/
Our average Polish originated Joe therefore earns a revenue of 100.8k PLN during calendar year. Let us clearly emphasize that this is revenue and not taxed income. According to the Central Statistical Office data for 2023, average Joe lives statistically for 74.7 years (let’s round it up to 75 in his favour) while his wife Jane lives 82 years. If Joe started working at the age of 18 and retired at the age of 65, this means he worked for 47 years, while his life partner, with the current local retirement assumptions, worked for 42 years. In our example, Joe has therefore generated a revenue of 5.7 mln PLN during his professional career, and Jane 4.2 mln PLN. (total rounded to 10 mln PLN). However, once again - this is a very theoretical example. It does not include inflation factor, taxes, contributions, expenses, acquiring professional skills that may affect the amount of salary, sick leave, etc. We have simply assumed a loose constant that Jane and Joe earn exactly same salary at the beginning and end of their professional activity and do not pay taxes whatsoever. Otherwise, 8.4k PLN, after all obligatory deductions, would be reduced to slightly over 6k PLN.
From the given level of earnings, one can easily imagine certain expenses that cyclically amount to thousands, sometimes even hundreds of thousands expressed in local currency. Joe and Jane have a certain scale of comparison in relation to the goods they purchase, whether it be a loaf of bread, coffee, posh dinner in a fancy restaurant, holidays, a new car or real estate.
This gives us a look at a certain scale that statistics-based Joe and Jane operate at. Rounded up, 10 mln PLN revenue generated during period of their professional activity equals approximately 2.5 mln USD. How could this be compared to, let’s say, market capitalization of Barrick Gold, which is at the level of 29.1 bln USD? Or to the capitalization of physical gold, which treated as an asset is estimated at 17 trl USD. This is the cause of cognitive dissonance caused by the abstractness of amounts appearing from a certain level. Therefore, to obtain more comprehensive view, it is necessary to make some figure comparisons, which is exactly what we propose to do.
However, at the end of the chapter, an additional note should be provided. Market capitalization is just one way to calculate size of a company or asset and generally involves multiplying number of shares by the current price. Being relatively simple and popular and widely used, we will focus on this method. All data comes from 2024, unless stated otherwise.
Exemplary Market Caps
Let’s start with “small” numbers. Precious metals analyst Don Durrett defines large gold and silver miners as having market cap of more than 3 bln USD. Below, are emerging large companies with market caps of 1.5 bln USD to 3.0 bln USD. Below are mid-tier miners, with market caps of 300 mln USD to 1.5 bln USD. And again, below this level are precious metals miners considered as Juniors—the riskiest but most rewarding.
Global precious metals giant Newmont Corporation is a diversified entity that until recently was able to mine nearly 6 million ounces of gold per year. In 2023, Canadians made acquisition of Australian mining giant Newcrest - which we described in our series 'Consolidations among gold miners'. Newmont is now in the process of financial analysis of assets and in the process of divesting some. Nevertheless, thanks to the transaction, its market cap is at about 48.3 bln USD. According to statistics, this makes it the most valuable gold 'miner'. In this way, Newmont has significantly outpaced its largest competitor, Barrick Gold with a capitalization of about 29.1 bln USD and another - Agnico Eagle, capitalized at 32.7 bln USD.
Barrick, Anglico and Newmont may be the leaders on precious metals mining, but they are not the largest in the metals mining sector. In terms of capitalization, these are BHP (146.1 billion USD), China Shenhua Energy (116 billion USD), Rio Tinto (112.6 billion USD), Southern Copper (84.2 billion USD), Glencore (70.9 billion USD) and Freeport-McMoRan (69.8 billion USD). However, all the aforementioned deal with a wider range of raw materials – iron ore, coal, nickel, copper, lead, molybdenum, zinc, uranium, aluminium, diamonds. And precious metals are only a part of their gigantic portfolio.

Top 50 ‘miners’. Not only for precious metals. Source: https://www.mining.com/top-50-biggest-mining-companies/
How does precious metals sector compare to others (in terms of the value of entities)? Industry reports estimate that size of the precious metals market (understood as gold, silver, palladium, platinum and platinum group metals) in 2023 amounted to 306.4 billion USD and is estimated to be at 323.7 billion USD in 2024. Although numbers here can vary dramatically depending on the reporting entity, which is why we are a bit sceptical about above. In terms of value, market is of course dominated by gold, which accounts for about 60% of its share, while platinum group metals account for about 25%. In terms of tonnage however, it is silver that undoubtedly dominates. Since we are talking about the sector collectively, without division into specific metals, industrial use of precious metals dominates, being responsible for over 45% of the share. Only then strong jewelry market (approx. 40%) and investment market (approx. 15%) appear.
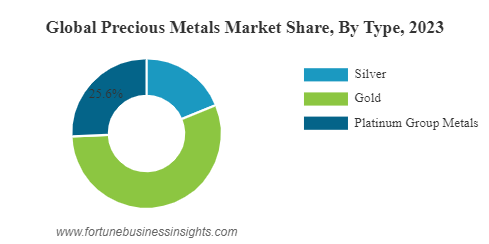
It’s no surprise that gold dominates precious metals sector. Source: https://www.fortunebusinessinsights.com/precious-metals-market-105747
But in search for truly big numbers on commodity markets, one should look to the energy sector, which deals with oil and natural gas. Unlike the numerous precious metals ‘miners’, energy sector is involved in the exploration, production and refining of oil and gas, which is basically all the steps leading to the creation of final product – the fuel. Then there’s only distribution left. Leaders in terms of market capitalization include BP (100 billion USD), but the largest of giants are Chevron (286 billion USD) and ExxonMobil (515.7 billion USD). Undisputable leader is Saudi Aramco (1.8 trillion USD), which is also one of the most valuable companies in the world in terms of capitalization.
How does estimated capitalization of the world's largest investment banks compare to the above? JPMorgan Chase dominates with a capitalization of 593 billion USD, followed by Bank of America (328 billion USD) and then Industrial and Commercial Bank of China Ltd (277 billion USD). The famous/infamous Goldman Sachs Group has capitalization of 157 billion USD. However, it should be remembered that among the bank's assets are bonds that have lost value in recent years due to the general increase on interest rates. Their nominal value does not correspond to the value markets would be willing to pay in a necessity to sell.

The cream de la crème of the international investment banking. Source: https://www.globaldata.com/companies/top-companies-by-sector/financial-services/global-banks-by-market-cap/
To cut it short, interested in tracking capitalization or revenues of US listed companies, we kindly refer referred to the Fortune 500 list. For our needs, we have rearranged top of it it in terms of capitalization, but you can also use revenue, if you prefer.
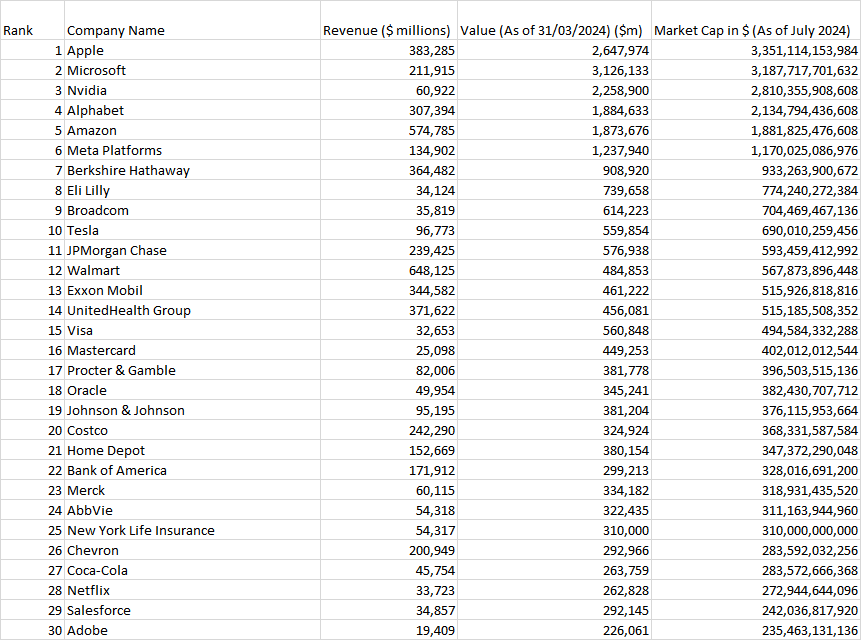
Top 30 most valuable US companies based on the Fortune 500 list. Source: https://eqvista.com/fortune-500-companies-in-the-us/
The crypto market should also be mentioned since we discuss market caps. Record capitalization of the cryptocurrency market was achieved at the end of 2021, when it reached USD 3 trillion globally. At that time, Bitcoin's dominance remained at 38-40%, meaning that all other cryptocurrencies were responsible for the rest of the value. The sharp decline in BTC's price caused altcoins to experience drastic declines, exceeding those of Bitcoin, thanks to which BTC regained dominance at 50%+. Currently, official market capitalization of BTC stands at 1.08 trillion USD, while valuation of the total cryptocurrency sphere is at 1.96 trillion USD, although these calculations may theoretically be underestimated by 1 trl USD. This is because various projects (altcoins) are born and die dynamically every day, with majority of them not being listed on the most important crypto exchanges.
So how does global estimated capitalization of physical precious metals look in comparison to all the the above? The methodological assumption multiplies estimated amount of precious metals mined so far, by current price per unit. This way, we obtain estimates that physical resources of mined palladium amount to 157.4 billion USD at the beginning of September 2024. For platinum, it would be 236.8 billion USD. Physical silver is worth 1.6 trillion USD and as an asset it can compete in size with the largest companies on the American market – Alphabet aka Google with a capitalization of 1.8 trillion USD, Meta Platforms aka Facebook with a capitalization of 1.2 trillion USD or Amazon (1.8 trillion USD). At the moment we have entered global top 10 for assets. On a top are Nvidia (2.6 trillion USD), Microsoft (3 trillion USD), Apple (3.3 trillion USD). However, it is gold that in undisputed manner dominates. Royal metal in its physical form remains the most valuable asset in the world, with an estimated market cap at 17.1 trillion USD.
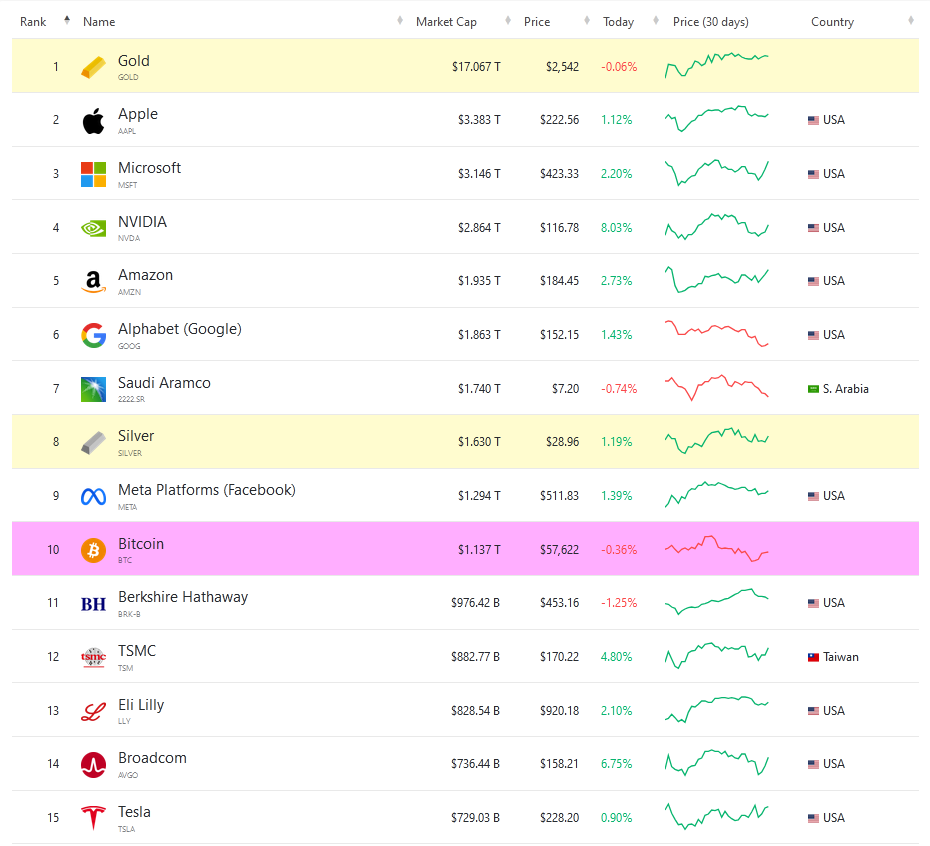
Despite the strong presence of gold, Saudi Aramco, silver and TSMC, the top of the most valuable assets in the world remains dominated by the USA. Source: https://companiesmarketcap.com/assets-by-market-cap
More about the capitalization of physical gold and silver
However, not all gold is the same. The oldest gold objects made by human hands were found in the vicinity of Varna, Bulgaria, and are dated to 4600-4200 BC. The 17.1 trillion USD is made up on assumption of certain continuity of its extraction from the dawn of human history, and accelerating significantly in the 19th, 20th and 21st centuries due to ongoing technological progress. Estimates even say that by 1850, humanity had collectively extracted up to 10 thousand tons of the yellow metal, and it reached volume of 100 thousand tons before the end of the second millennium AD. The amount of gold extracted to date also falls within a certain tonnage range. Depending on the source, we will most often come across a range of 190-244 thousand tonnes, of which, for example, World Gold Council reports 212.5 thousand tonnes.

Cumulative historical gold production over the last 200 years. The acceleration on trend is clear. Source: https://elements.visualcapitalist.com/wp-content/uploads/2023/04/global-gold-production-full-size.html
According to estimates based on data from the World Gold Council, Metal Focus, Refinitiv and the US Geological Survey, approximately 45% of the above volume remains in jewellery, 22% in investment products (bars and bullion) held in private hands, approximately 17% is owned by central banks / state treasuries and the remaining 15% are other, including e.g. technological use of gold, but also… gold teeth. Of course, these proportions could have undergone some cyclical change, for example due to increased rotation on the recycling market due to price increases or a strong purchasing trend among central banks. As a result of the pandemic, unrest, outbreak of war in Ukraine and the spectre of recession, gold investment also gained a boost in the form of exposure vehicles, namely bullion-backed ETFs, even if assets under management declined in recent quarters. In other words, of the $17.1 trillion in gold, only a fraction is “available” on hand for investment or speculation purposes.
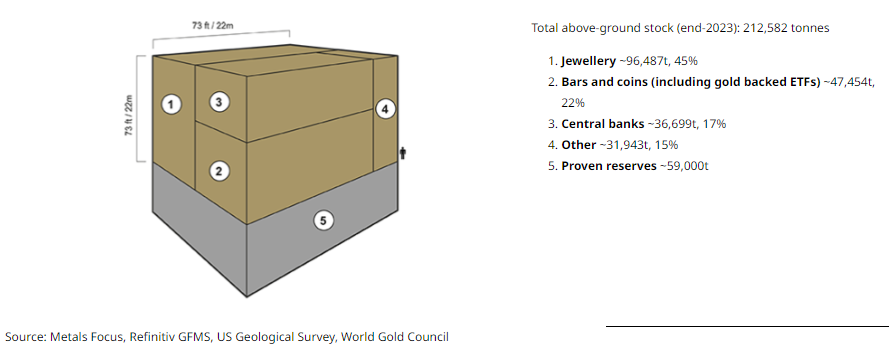
Estimates regarding the allocation of historically extracted gold. Source: https://www.gold.org/goldhub/data/how-much-gold
Additionally, it is important to remember on superiority of cultural value over metal value - this approach is particularly noticeable in the archaeological and historical branches, art history and numismatics. In other words, gold coins from ancient or medieval times have a much higher value expressed in local currency than if they were treated "only" as metal. An extreme example would be the 10.23 kg heavy funeral mask of Pharaoh Tutankhamun, decorated with precious and semi-precious stones, and made of solid gold. Weight of 10.23 kg is about 329 troy ounces. Assuming that an ounce is at 2.500 USD, its value will be over USD 820,000. In this example, we ignored certain weight of precious stones and simple fact that the ancients were not that tech savvy to make objects at 999.9 purity. Meanwhile, estimated auction value of the world-famous mask would be approx. 20 billion USD or even more. Although it is difficult to value something that should be treated as priceless for humanity and culture.
So, more realistically, that is without melting down artifacts stored in museums or ripping off gold gilding on Byzantine paintings, it should be assumed that gold in its investment ready form, constitutes approx. 40% of 17.1 trillion USD, which is 6.8 trl USD. And although we have reduced USD 17.1 trillion by almost 2/3, this still makes it the most valuable single asset known to man in terms of market capitalization.
Let’s adopt simillar approach for silver. According to the US Geological Survey, since the dawn of time, humanity has extracted 1.74 million tons of silver, or almost 60 billion ounces. Almost 75% of the above volume has been extracted since 1900. However, it is important to clearly note the historical loss of volume here. Holds of wrecks resting on the bottom of the Atlantic are full of gold and silver. Large volumes have also been lost as a result of warfares or other historical factors. Silver is also disadvantaged by its relative abundance in relation to gold, which affects price of the white metal. This means, that although recycling or attempts to recover gold from technological waste are profitable, the same cannot be sometimes said about silver.
Large numbers related to white metal are result of technological progress in mining and in general. This is because almost 75% of the silver volume is created "incidentally" to the extraction of lead, zinc, copper and other metals (including gold) needed by the technological and industrial sector. Based on the current figures, it seems reasonable to assume that 25% of silver is used for investment purposes, while the remaining volume is absorbed by the industrial, jewellery, and other sectors. This way, out of the estimated USD 1.6 trillion, we will be left with approx. USD 400 billion of physical silver for investment purposes.
This type of breakdown of our favourite assets in terms of use is of course justified, but we did not do it in relation to the companies and entities mentioned earlier. Therefore, we propose to stick to the previously adopted methodology. We also like the fact that 17 trillion in US dollars simply looks better. And by adding 1.6 trillion USD in silver, and almost USD 400 billion for physical palladium and platinum, market capitalization of the four most important precious metals will increase to USD 19 trillion. And this is probably not the last word spoken in this matter...
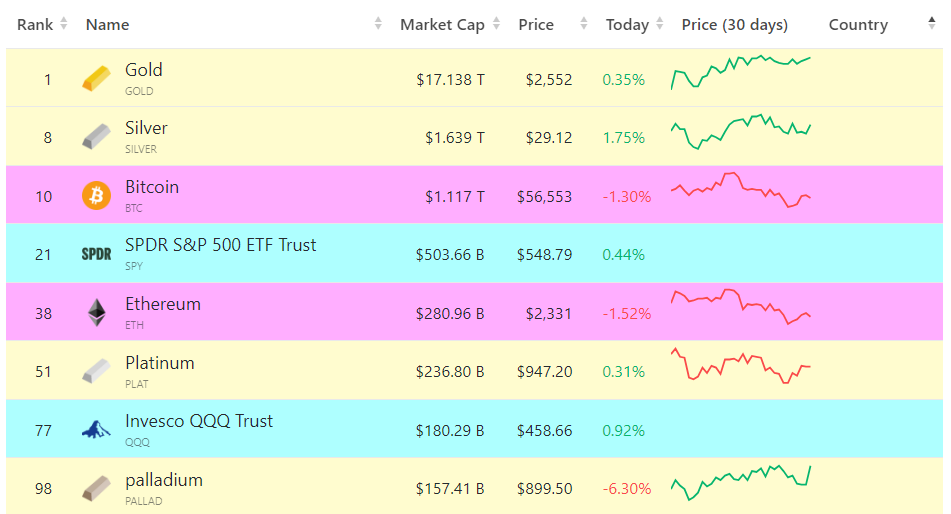
Physical gold, silver, platinum and palladium are among the 100 most valuable assets globally. Source: https://companiesmarketcap.com/assets-by-market-cap
Comparative values of a completely different scale
However, there are values of a completely different scale, and so it’s time to look on data of entire markets or indices. In comparison, even above-mentioned market capitalization of physical gold and all precious metals altogether seems to pale.
In recent years, lot had been said on market capitalization of the most important companies on the US stock exchanges. Tech giants mentioned in one go were Facebook, Amazon, Apple, Netflix, Google. Even the acronym FAANG was created from the first letters of these entities. But then changes began to occur - Netflix fell out of favour, Microsoft stepped in its place, Nvidia recorded gigantic increases, Tesla entered SP500, Google/Alphabet had been divided, problems affected Intel. And so we are now left with MegaCap-8 (Alphabet/Google, Amazon, Apple, Meta/Facebook, Microsoft, Netflix, Nvidia and Tesla) with a combined value of 14.8 trillion USD. Collectively, they constitute 28.5% of the weight of the SP500 index, weighing over 52 trillion USD (at least on the eve of the last US presidential debate).
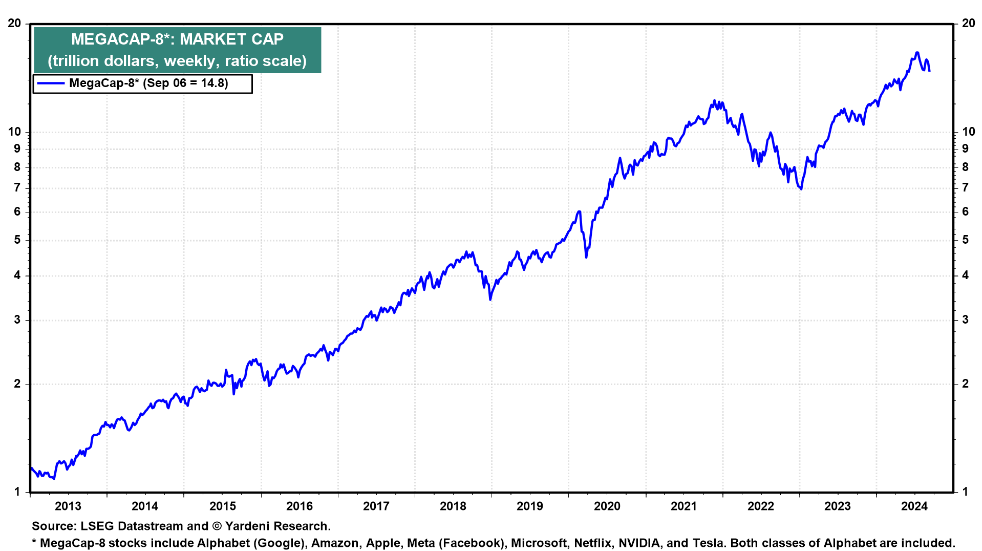
Who pulls and pushes SP500 up and down. Source: https://yardeni.com
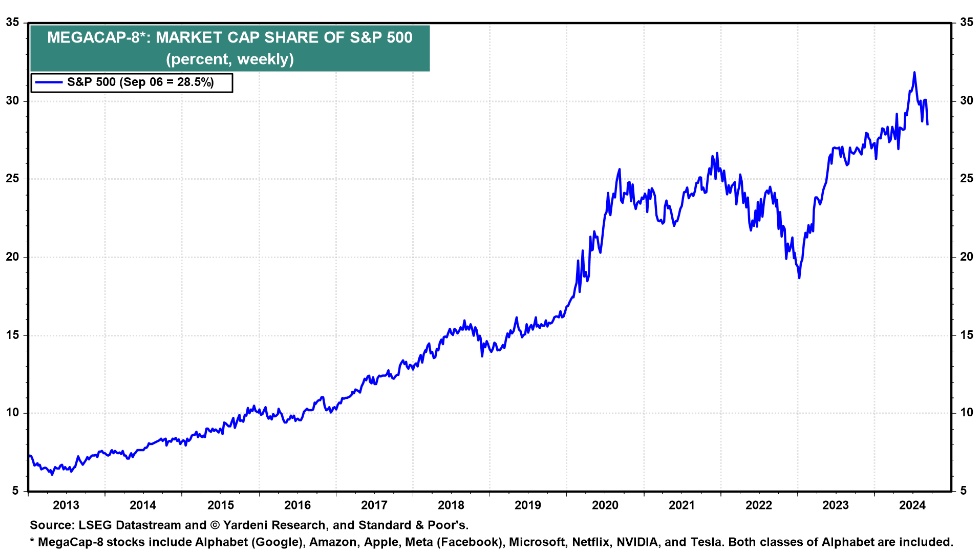
Weight of Megacap 8 in the SP500 index is undeniably large. Source: https://yardeni.com
But SP500 is an index. And it would be worth taking a closer look at the stock exchanges, because despite moments of correction, they are still close to historical record levels. At the end of 2020, New York Stock Exchange had a total capitalization of USD 22.3 trillion, which made it the largest stock exchange in the world. Since then, few things had changed and said NYSE has now capitalization of 28.4 trillion USD. Nasdaq follows right behind, with a capitalization of 25.4 trillion USD. Both American exchanges left Asian and European stock exchanges several lengths behind in terms of capitalization. Euronext is 7.2 trillion USD, Japan Exchange Group is 6.66 trillion USD, Shanghai Stock Exchange is 6.55 USD trillion, London Stock Exchange is 3.4 trillion USD and Frankfurt's Deutsche Boerse is 2.3 trillion USD.
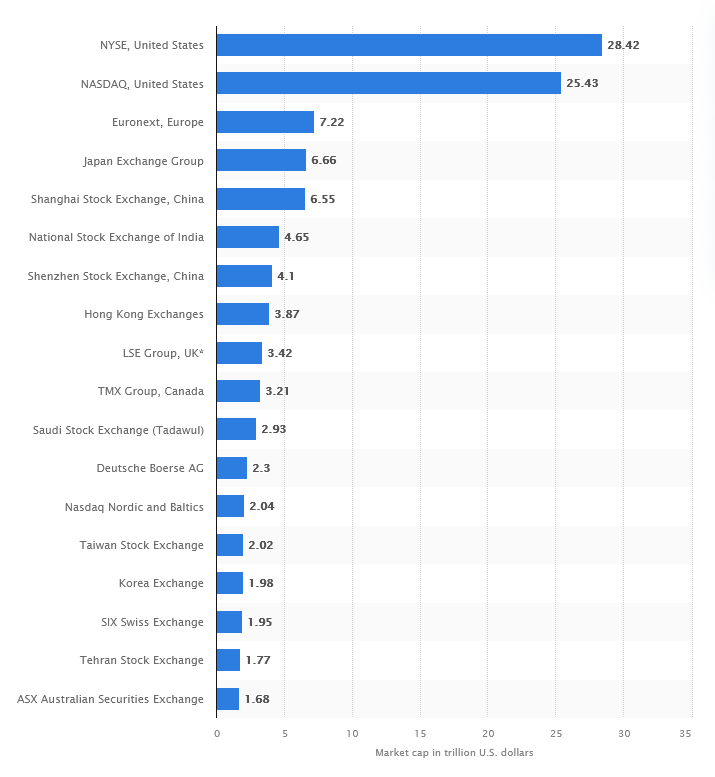
Stock exchange capitalization with individual breakdowns. Source: https://www.statista.com
Above is data from 2024, but we have an interesting statistical summary for Q3 2023. According to the World Federation of Exchanges, global stock exchanges had a capitalization of USD 107 trillion, of which the "Americas" accounted for 47%, Asia/Oceania for 30% and Europe for 23%. This explains why when the US sneezes, world gets cold.
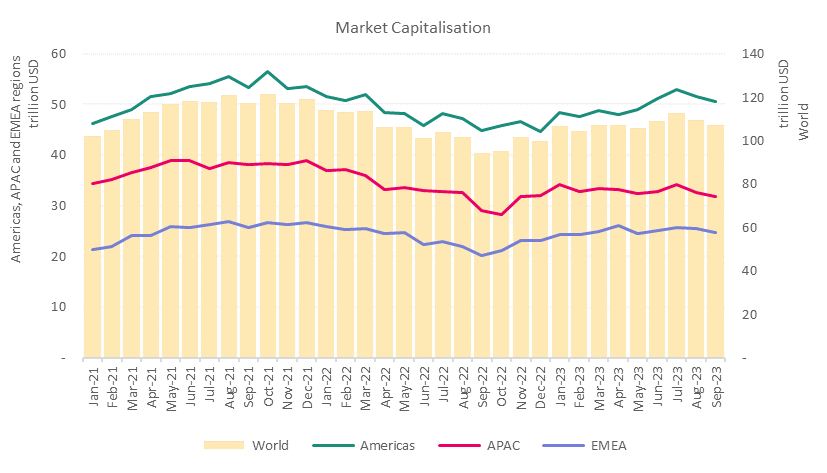
Cumulative global stock market capitalisation. Source: https://focus.world-exchanges.org/articles/market-capitalisation-q3-2023
However, these are still not the largest values we have - it's time to dive into debt statistics. In May 2024, Institute of International Finance reported that global debt was at 315 trillion USD for Q1 2024. Household debt amounted to 59.1 trillion USD, non-financial corporations to 94.1 trillion USD, government debt 91.4 trillion USD and financial sector 70.4 trillion USD. Developed markets are responsible for 2/3, emerging markets for 1/3 of above. Global debt amounts to 333% of global GDP. The bad news is that in dollar terms this is a record value. The good news is that in percentage terms it has been worse – peak was 360% and we reached it in 2021.
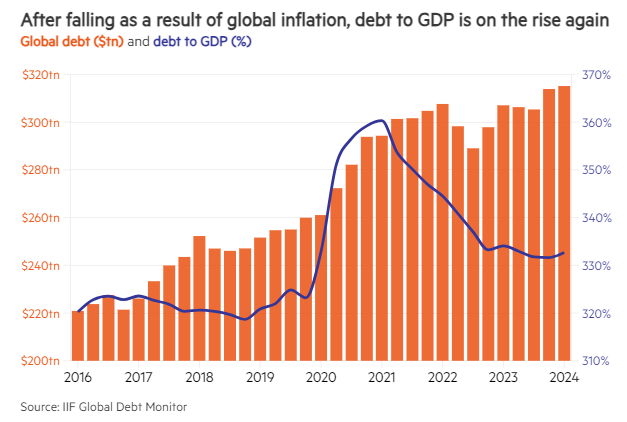
Global debt and world GDP. Source: https://www.thebanker.com/Global-debt-to-GDP-ratio-resumes-upward-trajectory-after-consistent-decline-in-2023
Is debt the final value? Global value of real estate is twice as high - at least according to some data sets, because here extreme discrepancies tend to appear. According to the most optimistic, global real estate is to reach USD 634 trillion in 2024. The strongest component here is the housing market, with value estimated at USD 516 trillion (other sets say 380 trillion USD for 2022, of which 287.6 trillion USD was housing).
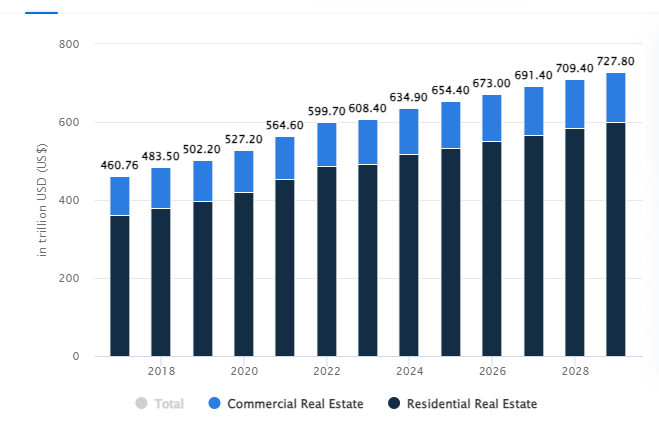
Global real estate market. Source: Statista
The North American market was responsible for almost 25% of the total value, despite the fact that only about 6% of the global population lives there. In case of Europe, real estate value also accounted for a similar percentage, but the percentage of the population living in the Old Continent is at approx. 10%. Even assuming more conservative dataset, global real estate "market" is at least 22 times larger than capitalization of physical gold.
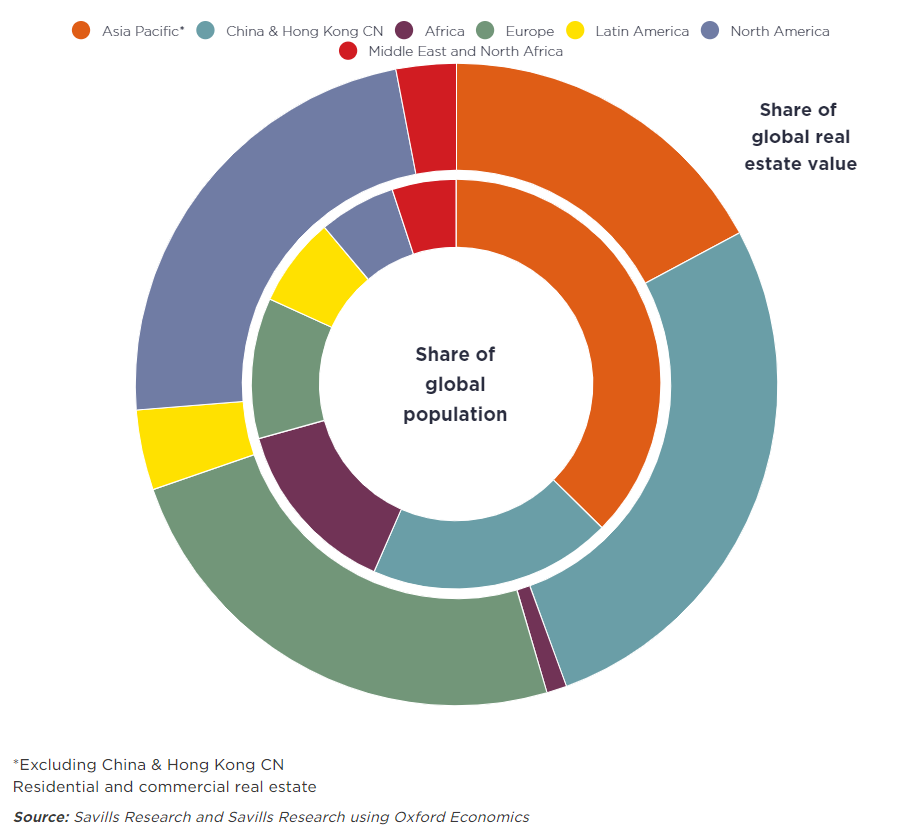
Geographic distribution of real estate market capitalization. Source: https://www.savills.com/impacts/market-trends/the-total-value-of-global-real-estate-property-remains-the-worlds-biggest-store-of-wealth
The real behemoth, and the last one on our list, is the derivatives market. These are contracts concluded between two or more parties on how the valuation of an asset, index or company will change. However, the issue is so broad and multi-stage complicated that creating a single definition for all types of derivatives is impossible. Examples include futures contracts, options, swaps, etc.
There are two ways of measuring derivatives. These are gross market value and notional value. An example call option for a derivative representing 100 shares at 1 USD each has a so-called strike price of $50. And so:
• Market value will be 100 shares * 1 USD per contract, or 100 USD.
• Nominal value is 100 shares * 50 USD strike price = 5 thousand USD.
As a result, for the derivatives we would be dealing with a gross market value of 12.4 trillion USD, which, however, according to the nominal value, would amount to at least 600 trillion USD, with maximums reaching 1 quadrillion USD. One with fifteen zeros. 1,000,000,000,000,000.
And since derivatives market is unregulated and therefore unmeasurable to a large extent, 600 trillion USD is figure calculated by Bank of International Settlements while higher number is an extremely loose estimate, although with solid foundations.
In conclusion
We talked a bit about values and cited numerous statistical data. In particular, the last chapter can be intimidating due to the weight of the numbers presented. However, it is important to remember to maintain common sense and not fall into excessive pessimism. On the one hand, it is clear that the precious metals market is doing well in terms of capitalization, compared to other assets with real value. On the other hand, it is clear that there is for precious metals further room for growth.
Gold started 2024 at 2,081 USD per ounce. Recent gains (up to 2,500 USD) allowed yellow metal to become the best performing traditional asset of the current calendar year. And since it provided a return on investment of 20%+, while SP500 was at 18%+, such trend continuation may provide an additional upward impulse for the growth of the valuation of gold mining companies.
And so, sector is doing well, and is waiting for more.